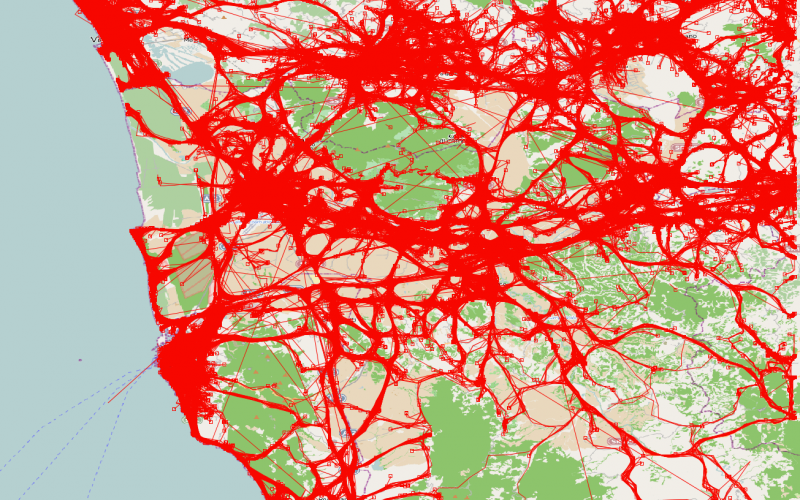
With M-Atlas is easy to build trajectories from data stored into the database. It is also possible to apply several constraints during the import in order to cut trajectories into more meaningful representations of the users activities e.g. if the user remain in the same area for long time than this is used to separate the whole trajectory into two trips.
-
-
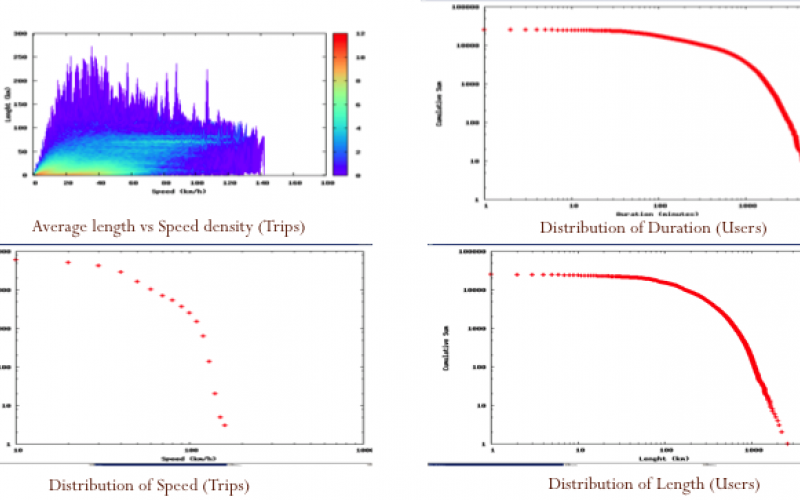
M-Atlas provides a set of statistical analyses which can be performed on a trajectory dataset giving the basic tools for understanding the data features and the global distributions.
-
M-Atlas gives to the user the possibility of selecting, filtering, cutting in space and time trajectories in order to navigate the data and building the analytical process as much flexible as possible. An example is selecting trajectories according to their length.
-
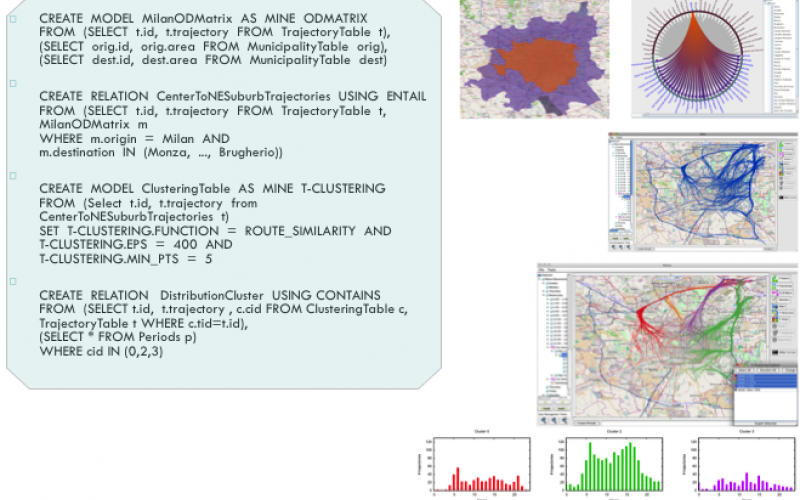
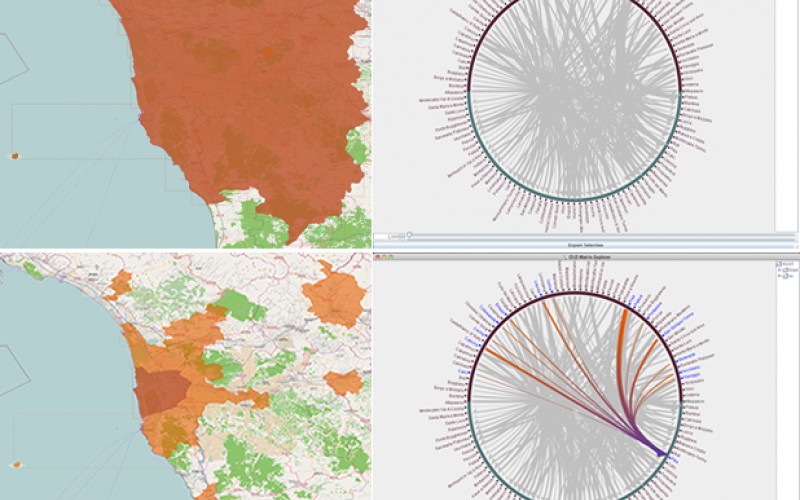
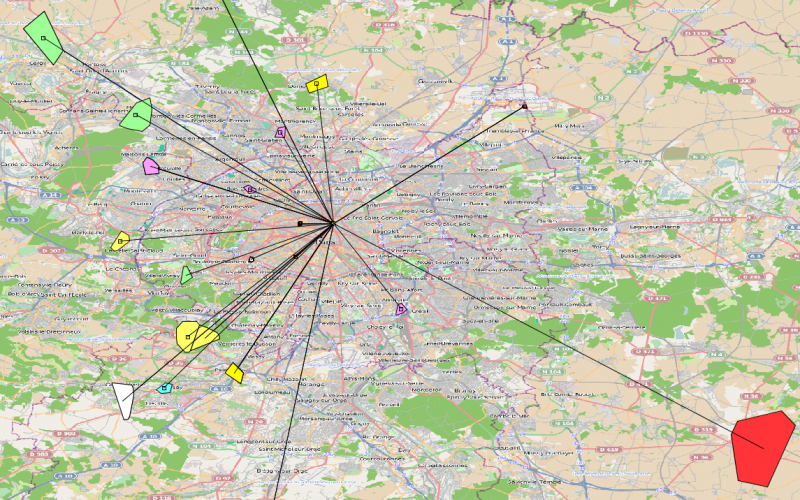
Given a trajectory dataset and a space partitioning M-Atlas is able to compute and represent an interactive O/D Matrix. The user can navigate the results selecting the desired flow or a combination of them to be extracted and to be used as base for further analyses with other tools.
-
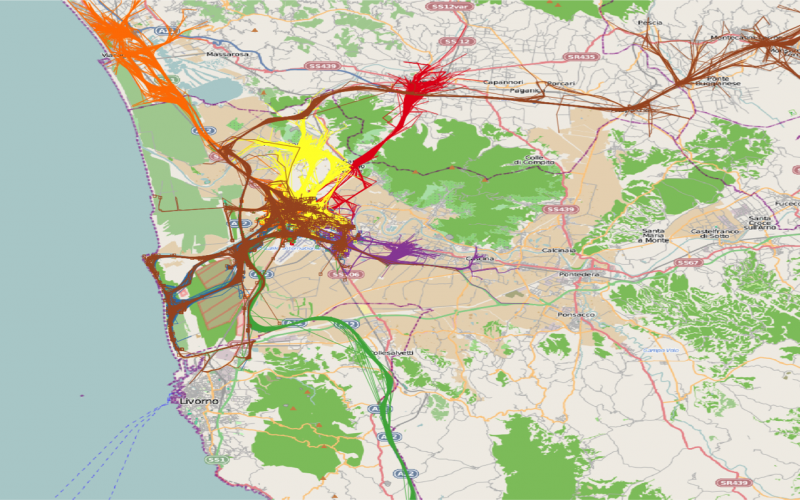
M-Atlas integrates a powerful clustering algorithm (density based) equipped with several distance functions able to group the trajectories in different ways adapting to the user needs. An example is the discovery of the access paths of the city. This is another brick that can be used in a more complex analytical process.
-
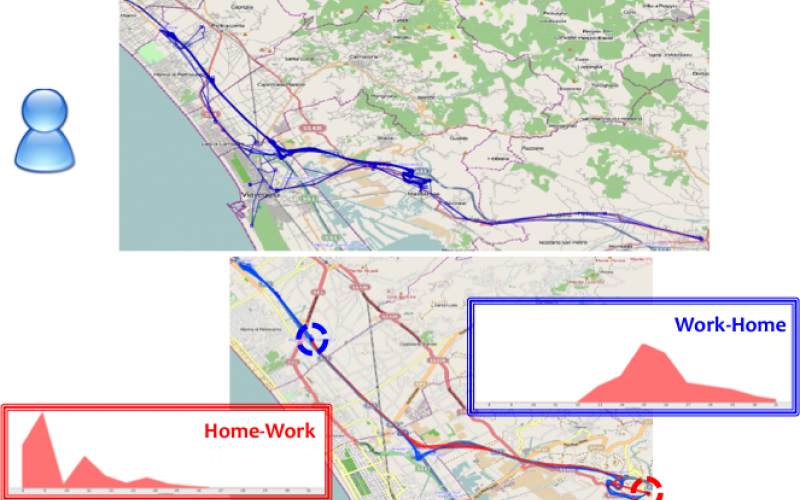
With M-Atlas is possible to study the global behaviors but also the personal mobility of the user in order to modeling it such as extracting mobility profiles. Thanks to the DMQL the process applied for one user may be replicated over all of them systematically.
-
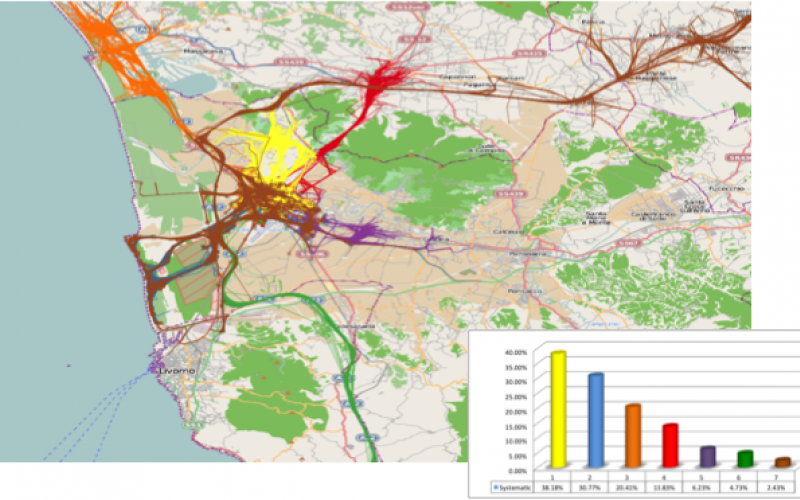
M-Atlas and DMQL gives the possibility of mixing the analyses discovering more useful and detailed knowledge from the trajectory data. An example is to classify the trajectories into systematic or occasional looking at the personal mobility of each user and then use this classification to evaluate the systematic behavior impact over the access path in a city.
-
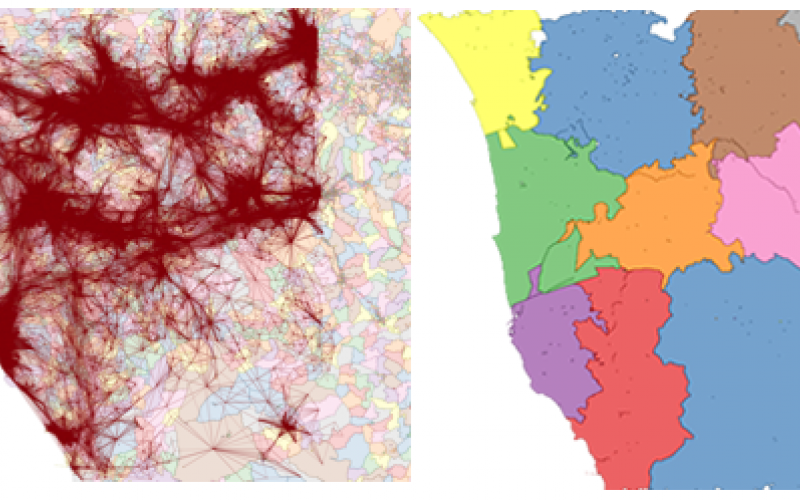
M-Atlas is able to analyze the mobility in terms of interconnection between adjacent areas in orders to extract the real borders between less string connected regions and less connected ones.
-
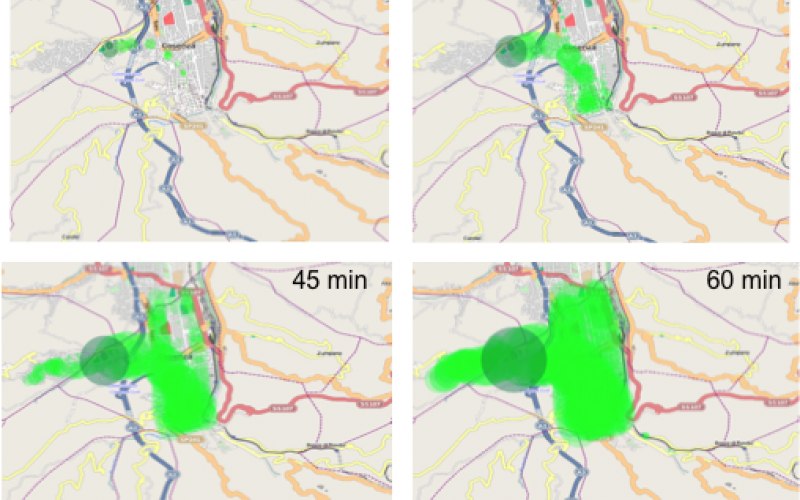
Thanks to the flexibility of M-Atlas several analyses can be expressed by the DMQL. An example is the analyses of the Public Transport coverage in terms of understanding which city areas are reachable by the citizens using the public transportation having a limited amount of time and a limited walking distance capability.
-
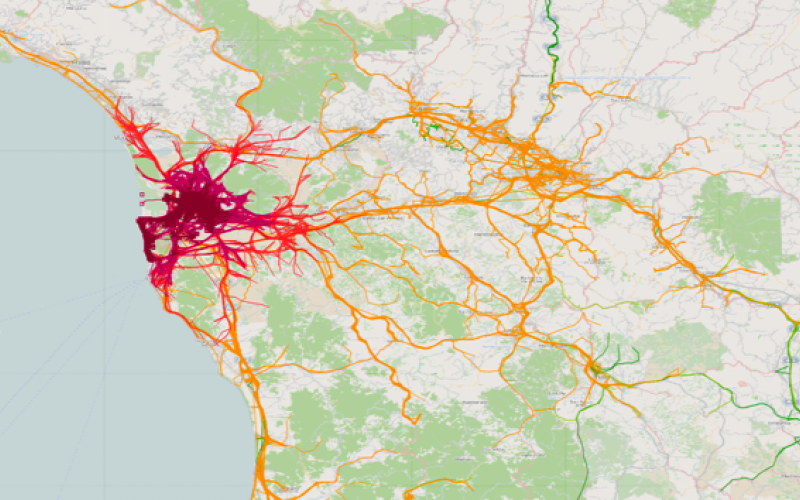
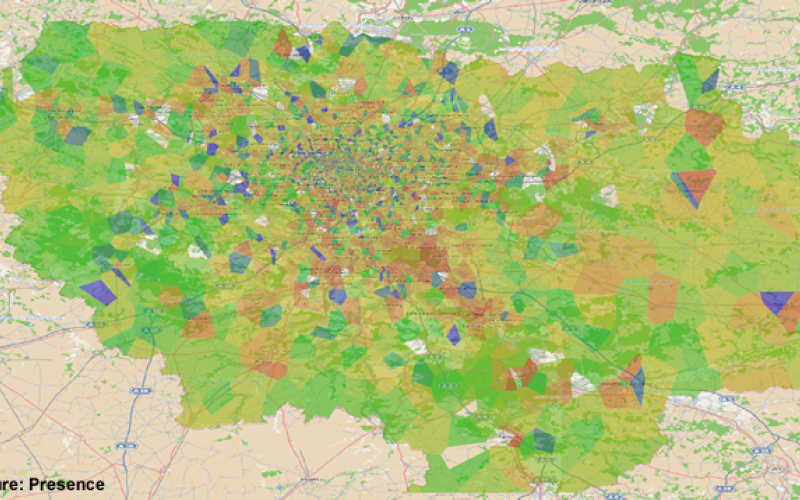
A particular kind of statistical analyses are the space distribution where a measure is plotted on a map to represent a distribution such as density, average speed or CO2 impact.
-
M-Atlas integrate The Correlation Pattern algorithm which is able to extract correlations between areas linked by events consequentiality. This helps the users in discovering underlying relations and study them.
-
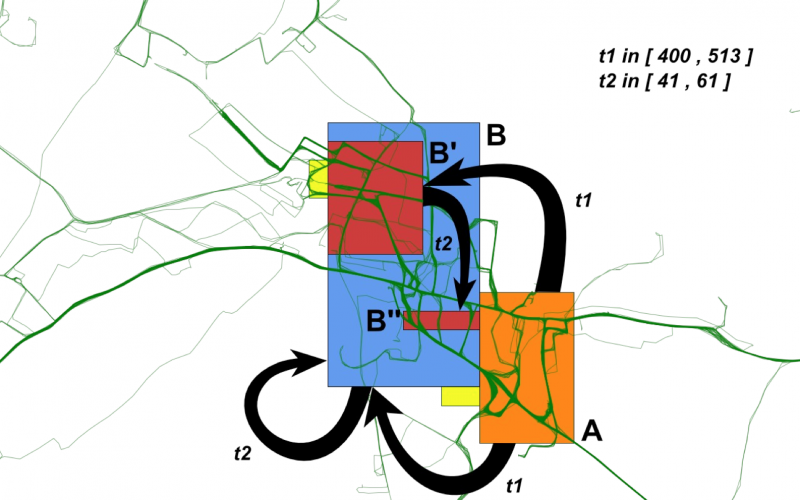
M-Atlas integrates the Trajectory Pattern algorithm which is able to extract the frequent spatio-temporal patterns over a trajectory dataset. They are represented in terms of sequence of regions with temporal intervals frequently used between each pair. This can be used to detect local flows of citizens moving over the city.
-
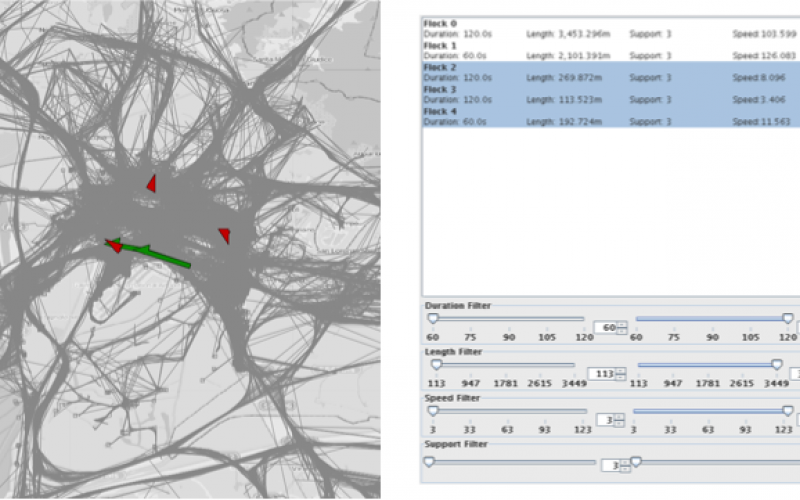
Thanks to a Flock discovering algorithm M-Atlas is able to capture citizens which move in together for a certain amount of time. This can be used to spot traffic jams in trajectory car data understating the critic areas of a city.
-
All the processes in M-Atlas are described by a combination of DMQL queries which are able to describe all the process and therefore let the user to transfer his knowledge easily.